- Explainer
- Warehousing
- 4 min read
- Last verified 2 November 2026
Inventory turnover and days of inventory explained
What inventory turnover and days of inventory measure, how to calculate each from financial statements, and how to read the results without misusing them.

In short
Inventory turnover counts how many times stock is sold and replaced in a period. Days of inventory converts that count into days, so a lower day figure generally means stock moves faster. Use the same period and the same inventory basis every time you compare.
Inventory turnover and days of inventory answer one question: how long stock sits before it leaves the business. Warehouse managers, forwarders planning buffer stock, and brokers reviewing a client's accounts all meet these figures, often without a clear definition. Both come from the same two financial statement figures, so they move together and are easy to confuse.
What the two figures measure
Inventory turnover shows how often a business sells its stock and replaces it within a set period, usually a year. The U.S. Securities and Exchange Commission's beginner guide to financial statements sets the ratio against cost of sales and average inventory for the period. Read literally, a result of 2 means the stock turned over twice in the reporting period. Trade reports sometimes call the same measure inventory turns, so check the definition in any report you read.
Days of inventory, often called days inventory outstanding, takes the same idea and expresses it as time. Instead of asking how many times stock turns, it asks how many days stock is held, on average, before it sells.
Calculating inventory turnover
Start with two figures. The first is cost of sales, which appears on the income statement just below net revenues. The second is average inventory. Add the inventory balance at the start of the period to the balance at the end, then divide by two. The opening balance is the prior period's closing balance, so both points come from the balance sheet.
Then divide cost of sales by average inventory. UNCTAD's teaching module uses the same method, with cost of goods sold for the period as the numerator. Keep both figures on the same basis. Pair annual cost of sales with annual averages, or quarterly figures with quarterly averages, and avoid mixing a monthly sales total with a yearly stock figure.
Check how the company values its stock as well. A change in inventory valuation can move both cost of sales and the inventory balance, so the ratio can shift even when the physical stock has not changed.
From turnover to days of inventory
To get days, divide the number of days in the period by the turnover ratio. UNCTAD's payables illustration divides the days of the year, 360 or 365, by the turnover ratio, and its inventory illustration turns a monthly ratio of 3 into 10 days. The arithmetic is the same throughout: fewer turns mean more days, and more turns mean fewer days.
The UK tax authority, HM Revenue and Customs, uses a different basis in its enquiry manual. It multiplies the value of stock by 365 and divides by the value of purchases to estimate days of stock in hand. This is a check used when reviewing low stocks or possible undervaluation, so it is not a substitute for the cost-of-sales method. The lesson is that the base you choose changes the answer, so state it in every report.
Reading the results
A high turnover generally points to fast-moving goods, while a lower figure suggests a lag in sales. Gartner's inventory turns benchmark, as reported by Supply Chain Dive, divides cost of goods sold by quarterly average inventory and notes that the exact number varies greatly by industry and company. Comparing a grocer with a jeweler tells you little. Compare a company with its own history and with close peers.
A very high turnover is not automatically good. Stock held too thin can cause stockouts and lost sales. A low figure can reveal slow-moving stock, overbuying or obsolescence, but confirm the cause before acting. For a forwarder or warehouse operator, the figure is most useful as a trend, measured the same way each period.
Common mistakes to avoid
The most frequent errors are mixing periods, mixing bases and comparing across industries. Using a quarter's cost of sales against a full year's inventory will overstate the turnover, and using purchases where cost of sales is expected will change the result.
Also confirm whether the figures are reported in the same currency and units, especially when a company reports across several countries. A ratio is only as reliable as the inputs behind it.
Side by side
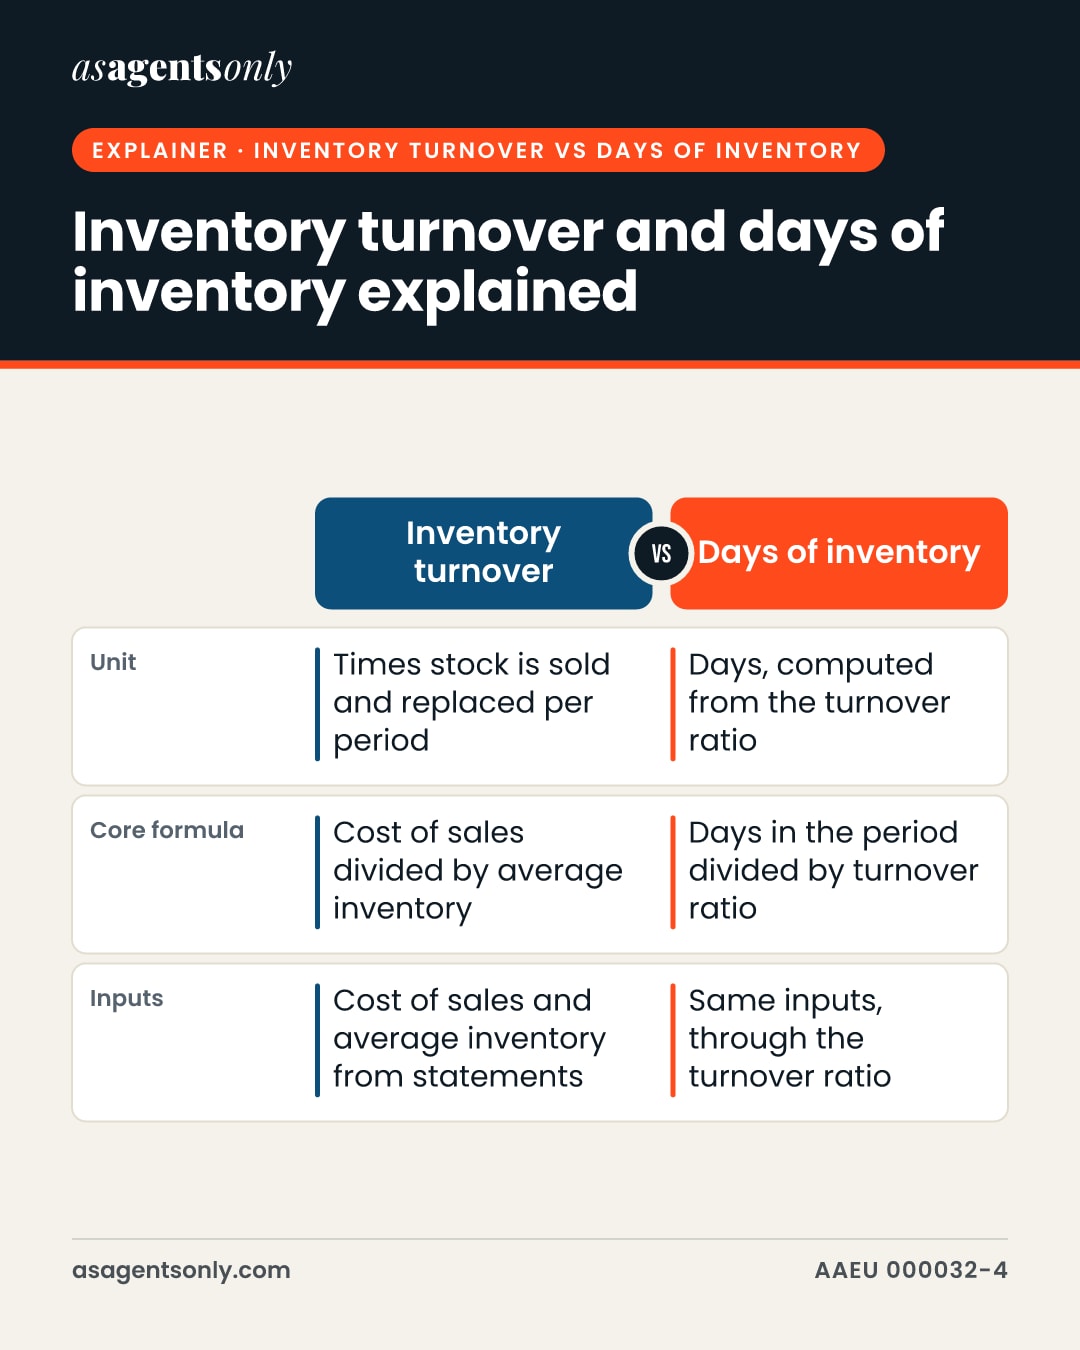
| Compared | Inventory turnover | Days of inventory |
|---|---|---|
| Unit | Times stock is sold and replaced per period | Days, computed from the turnover ratio |
| Core formula | Cost of sales divided by average inventory | Days in the period divided by turnover ratio |
| Inputs | Cost of sales and average inventory from statements | Same inputs, through the turnover ratio |
Example
Illustrative example, not a real company: a distributor reports cost of sales of six hundred thousand dollars for the year. Its stock was one hundred twenty thousand dollars on the first day and one hundred eighty thousand dollars on the last. Average inventory is therefore one hundred fifty thousand dollars, so turnover is four times for the year. Dividing three hundred sixty-five days by four gives about ninety-one days of inventory. If the same distributor later reports purchases instead of cost of sales, the figures will differ, so the basis must be stated.
In pictures
The same facts as this page, as images to save or share. Tap one to open it full size.
Official sources
- Beginners' Guide to Financial StatementsU.S. Securities and Exchange Commission
- EM3087 - Examining Accounts: Business Ratios: Stock and Work in Progress - Low Stocks or UndervaluationHM Revenue and Customs (GOV.UK)
- Are companies turning inventory faster?Supply Chain Dive
- What Is a Good Inventory Turnover Ratio?FreightWaves Ratings
Claims ledger: 15 facts and where each comes from
- The SEC's beginner guide defines inventory turnover as cost of sales divided by average inventory for the period.1
- The same SEC guide explains that a ratio of 2 to 1 means the inventory turned over twice in the reporting period.1
- Average inventory is found by adding the balance for the period to the balance for the previous comparable period and dividing by two.1
- Cost of sales appears on the income statement just below net revenues.1
- UNCTAD's module describes inventory turnover as cost of goods sold for a period divided by average inventory.2
- UNCTAD's illustration converts a monthly inventory turnover ratio of 3 into 10 days by dividing 30 by 3.2
- In UNCTAD's payables illustration, the days of the year, 360 or 365, are divided by the turnover ratio.2
- HMRC's enquiry manual gives a formula: value of stock multiplied by 365, divided by value of purchases, equals the number of days stock in hand.3
- HMRC's enquiry manual also gives stock turnover as value of purchases divided by average opening and closing stock.3
- HMRC's enquiry manual section covers low stocks or undervaluation when examining business ratios.3
- Gartner calculates inventory turns as cost of goods sold divided by quarterly average inventory.4
- Gartner's reading holds that a high turn rate suggests fast-moving goods, whereas lower measures suggest a lag in sales.4
- The exact inventory turns number varies greatly by industry and company.4
- The rate at which a company sells and replaces its inventory is known as the turnover ratio.5
- A good inventory turnover ratio differs from one industry to the next.5
Every figure on this page is tied to a cited source, last checked on 2 November 2026. Pages like this are re-checked every six months. Found something out of date? Tell the desk.