- How-To
- Warehousing
- 3 min read
- Last verified 29 October 2026
How to calculate safety stock and a reorder point
Calculate safety stock and a reorder point from demand, lead time and their variability, so you know when to place the next order.

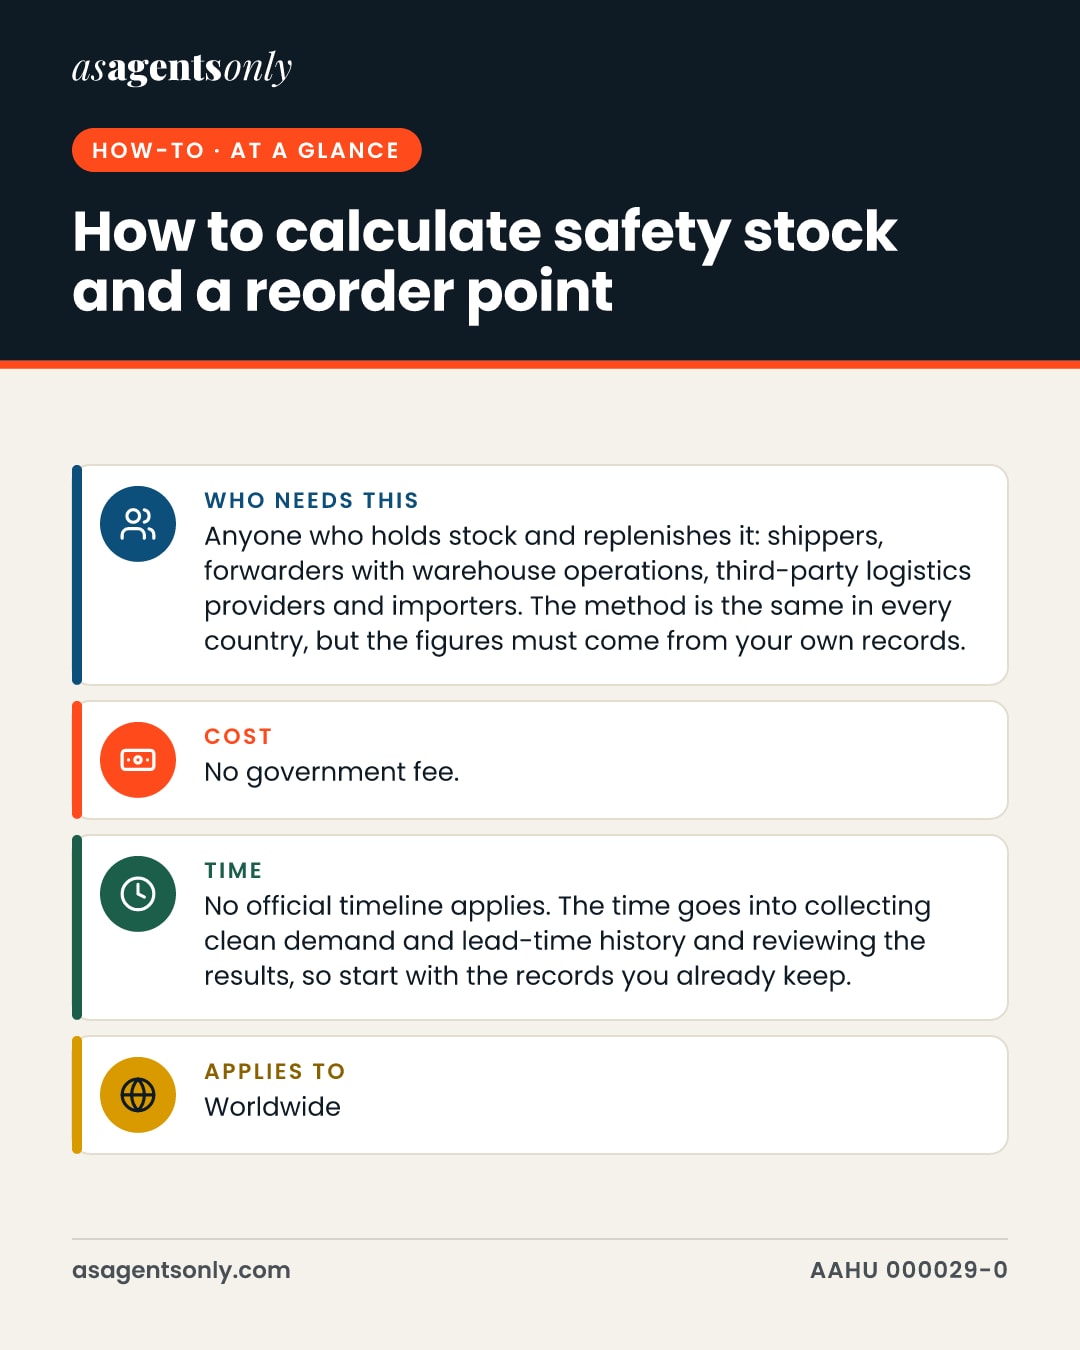
- Who needs this
- Anyone who holds stock and replenishes it: shippers, forwarders with warehouse operations, third-party logistics providers and importers. The method is the same in every country, but the figures must come from your own records.
- Cost
- No government fee.
- Time
- No official timeline applies. The time goes into collecting clean demand and lead-time history and reviewing the results, so start with the records you already keep.
- Applies to
- Worldwide
Safety stock is the buffer you hold above expected use so a late supplier or a demand spike does not empty your shelves. The reorder point is the stock level at which you place the next order. No standards body publishes one mandatory formula. The simple version below comes from a UK government guide, the statistical version from trade press, and the U.S. federal inventory rule shows how the same concepts are framed in regulation.
Step by step
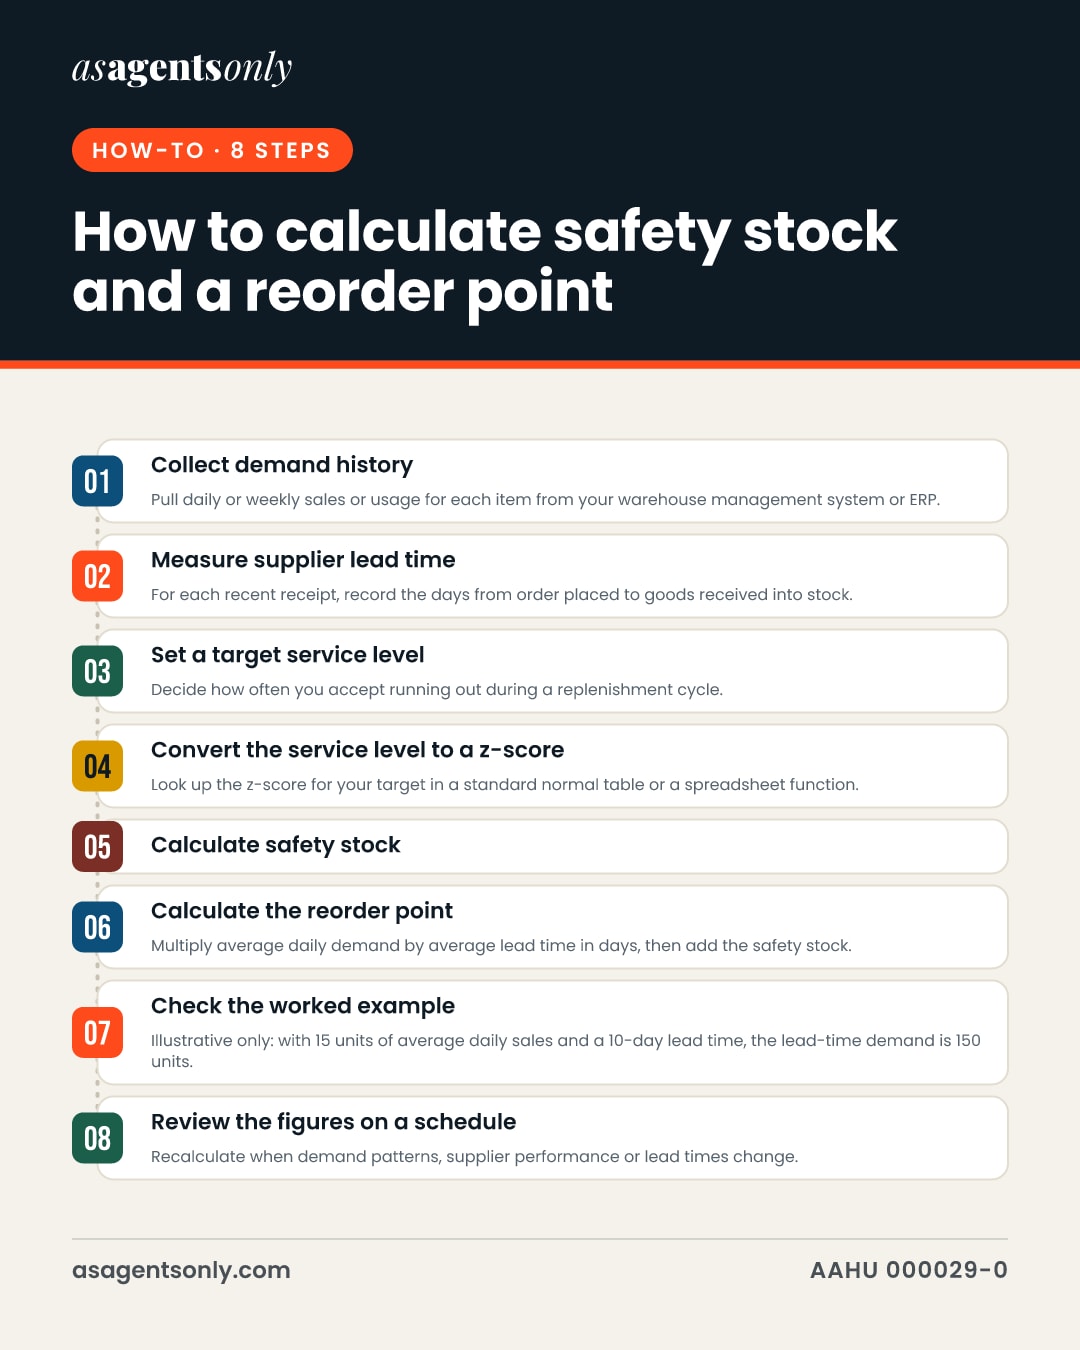
Collect demand history
Pull daily or weekly sales or usage for each item from your warehouse management system or ERP. Use one unit of measure and one time period throughout. Calculate the average demand and its standard deviation.
Measure supplier lead time
For each recent receipt, record the days from order placed to goods received into stock. Calculate the average lead time and its standard deviation. Use receipt dates, because those are the dates your stock actually changes.
Set a target service level
Decide how often you accept running out during a replenishment cycle. The guide treats this as a business decision about the level of service the company wants to provide. Write the target down so it can be reviewed.
Convert the service level to a z-score
Look up the z-score for your target in a standard normal table or a spreadsheet function. A z-score of zero gives about 50 percent coverage, and a z-score of 1 gives about 84 percent coverage, so the buffer grows as the target rises.
Calculate safety stock
Use safety stock = z × √((average lead time × demand standard deviation²) + (average demand² × lead time standard deviation²)). The formula assumes demand and lead time are roughly normally distributed. If either pattern is badly skewed, test the result against your actual stockout history before relying on it.
Calculate the reorder point
Multiply average daily demand by average lead time in days, then add the safety stock. Compare this figure with your inventory position, meaning on-hand stock plus confirmed open orders, and place a new order when the position falls to the reorder point.
Check the worked example
Illustrative only: with 15 units of average daily sales and a 10-day lead time, the lead-time demand is 150 units. Adding 75 units of safety stock gives a reorder point of 225 units. The 50 percent buffer is a guide figure, not a rule, so replace it with your own calculated safety stock.
Review the figures on a schedule
Recalculate when demand patterns, supplier performance or lead times change. Set a recurring review date for each item, and record who approved each change to the reorder point.
Documents you will need
- Sales or usage history for each item, with dates and a single unit of measure
- Purchase order and goods receipt dates for recent deliveries from each supplier
- Current on-hand stock, confirmed open orders and known backorders
- Your target service level for each item or item group
- The z-score table or spreadsheet function you use
- Any known seasonal peaks, promotions or planned supplier changes
Common mistakes
- Mixing units or periods, such as daily demand with weekly lead time, which produces a reorder point that is wrong by a factor of seven. Convert everything to one unit and one period first.
- Treating the textbook formula as universal. The formula assumes normally distributed demand and lead time, so check the pattern in your own data before relying on the result.
- Ignoring lead-time variability. Variable supplier lead times increase safety stock even when average demand is steady, so measure the spread, not just the average.
- Expecting safety stock to prevent every stockout. It is designed to prevent most stockouts, not all of them, so keep a process for expediting when one occurs.
- Chasing a near-100 percent service level without checking cost. Safety stock rises steeply above 95 percent, so set the target by weighing the cost of extra stock against the cost of lost sales.
In pictures
The same facts as this page, as images to save or share. Tap one to open it full size.
Official sources
- How to manage your inventory for multiple online channelsGOV.UK (business.gov.uk)
- eCFR 41 CFR Part 101-27 Inventory ManagementeCFR (Office of the Federal Register)
- Inventory Management - Four Common Pitfalls of Safety StockSupply Chain 24/7
- What Drives Inventory in Your Supply Chain?Supply Chain 24/7
- Demystifying Inventory OptimizationSupply Chain 24/7
- Inventory Optimization Evolving from Fad to NecessitySupply Chain 24/7
Claims ledger: 17 facts and where each comes from
- The UK government guide gives the reorder point as average daily sales volume multiplied by lead time, plus safety stock.1
- The UK guide's illustrative example uses an average daily sales volume of 15 units and a lead time of 10 days.1
- In the UK guide's example, the reorder point works out to 225 units, made up of 150 units for lead-time cover and 75 units of safety stock.1
- The UK guide states that the safety stock level is often set at 50 percent in many cases.1
- Under 41 CFR 101-27.101, safety stock is the portion held to protect against stock depletion when demand exceeds average expected demand or when lead time is longer than anticipated.2
- Under 41 CFR 101-27.101, safety stock levels should consider demand and lead-time fluctuations, the essentiality of items, and the additional costs of greater availability.2
- The most commonly used safety stock model will calculate the necessary safety stock to achieve a target service level provided that both lead time and demand are normally distributed.3
- The amount of inventory needed for demand variability is the product of the square root of average lead time and the standard deviation of demand.4
- Lead-time variability is covered by the average demand over that period multiplied by the standard deviation of lead time.4
- With a z-score of zero, the model gives enough inventory to meet demand 50 percent of the time.4
- With a z-score of 1, the safety stock protects against one standard deviation, giving enough inventory 84 percent of the time.4
- For normally distributed demand and replenishment times, z is a constant set by the desired service level, alongside average and standard deviation of lead time and average and standard deviation of demand.5
- Safety stock is designed to prevent most stock-outs, not all of them.3
- Variability in lead time increases safety stock.3
- Safety stock increases exponentially above a 95 percent service level, and is theoretically infinite at 100 percent.3
- Safety thresholds should be reviewed periodically, because as conditions change, the thresholds should change too.6
- Service level is a policy decision about the level of service the company wishes to provide.7
Every figure on this page is tied to a cited source, last checked on 29 October 2026. Pages like this are re-checked every three months. Found something out of date? Tell the desk.